Generating Sample Data with Microsoft Copilot
- Robert Ward

- Aug 13, 2025
- 6 min read

Use of real data for testing, training, and development scenarios is problematic for security, integrity, and ethical considerations. This is especially true for copying production data.
On the other hand, good test data is important for validating new and unexpected scenarios, and training is far more effective if the training data aligns with what participants experience in the real world.
Copilot and similar tools are known as generative artificial intelligence because of their ability to use complex mathematical techniques and statistics to simulate the expected outputs given a set of inputs, for example prompts. This makes it ideal for crafting and generating sample data to align to development, testing, and training scenarios.
This is even more pertinent when considering the limitations of human authoring of sample data. People are not good random data generators. Large volumes of data are time consuming to generate and the automation of the process tends to introduce systematic patterns that aren’t reflective of real situations. In addition, people can unintentionally reflect live data in their test sets. At worst, production data is copied with a light mask on top.
This blog is based on exploring the techniques described for generating sample data in the Microsoft article Use Copilot to create sample data for Field Service.
Step 1 - Define your template(s)

As with any data project, the first and most important step is to determine the tables and columns or attributes.
For generative data, this includes any specific format requirements but also ‘realism’ characteristics of the data.
Example considerations for formatting:
Email address requirements, for example first.last@domain.com vs lastfirstinitial@domain.com
Phone number formatting (with or without country code)
Special characters exclusion or inclusion, including if there are requirements to test the capability of the test system to handle special or unexpected characters
Number formats, including variations such as commas, symbols (eg currency), negatives, and/or random quantity of decimals
Example realism characteristics:
Should place names map to real place names, or be fake?
What geographical areas should be considered?
Should GPS coordinates correspond to real street addresses, but the street address columns in the sample data will be fake?
Is there some level of grouping to apply, for example a maximum of 5 unique job titles with between 3 and 10 employees per job category?
Note that one of the benefits of prompt chaining is that the upfront requirements definition does not need to be exhaustive or exact. As long as the prompt is in the right general area, then the actually sample data set can be iterated over multiple prompts.
Step 2 - Create a prompt

Describe the data template in words, including the characteristics of the data.
Include a request for how many rows of data. Note there will be a limit on the number of rows that can be generated at a time, so start with a smaller number of rows to refine the prompt and then use iteration to generate more rows if needed.
Some considerations:
Most LLMs allow upload of examples. You can use this feature to upload the column headers such as via a csv template.
No non-public or production data should be included anywhere, especially as example data for the prompt. The objective of the exercise is to avoid any live data getting into the samples. The challenge is to describe what the data looks like without giving anything away.
As well as refining the sample data requirements, iterative prompting is a good way to step Copilot through the sample data generation rather than attempting a single massive prompt.
Step 3 – Review the results and iterate

Review the output of the initial prompt and how well it matches to the desired characteristics.
Did you ask for town names but the samples vary from 3 person towns to 1 million person cities? Maybe specify that the only town names that can be used are those with a population between 10,000 and 100,000 people.
LLMs can often use public information sources as examples, for example there may be a careers site with a blog of common job titles or even a jobs site
Is there too much variety in values for a column that should be more uniform, such as a company department name? Maybe specify a maximum number of unique values.
If the initial dataset is looking good, ask Copilot to generate a new quantity of rows following the same characteristics.
Step 4 – Record the requirements, prompts, samples and lessons learned
Sometimes sample data can be reused multiple times, for example to run the same tests, but often there are requirements to generate similar but different datasets based on feedback or to cover different scenarios.
Following the above process for first time sample data generation can take hours. However, by recording the requirements, prompts, samples, and the quality of the generated data, the same pattern can then be used for subsequent projects to rapidly generate new datasets. Prompt chaining allows for tweaks to get the desired outcome, rather than needing to start the whole process from the beginning.
Example scenario
A Microsoft 365 tenant to validate some scenarios in Microsoft Teams. This is a trial, so we want to use fake data only.
Example Step 1 – Define the templates
Microsoft helpfully provides the ability to upload user accounts, including a template csv.

There are some additional goals:
The trial tenant allows for up to 25 users. I am already an admin, so I can add 24 other accounts
User ids need to be an email style format
Workers should be located around Sydney, NSW, because we want to test collaboration scenarios and it’s helpful to ground the dataset
I’ll include limits on the number of departments and job titles, because a lesson from previous prompts is that there is too much variety in naming if there’s no constraints
Example Step 2 – Create a prompt
Prompt sample:
Create a CSV format list of 24 users with the following fields: concatenation of First name and Last name and @ and CSMTrial.onmicrosoft.com = username, fake first name = First name, fake surname = Last name, concatenation of First name and a space and Last name = Display name, fake job title for a facility worker = Job title, fake department related to the job title = Department, blank field = Office number, blank field = Office phone, blank field = Mobile phone, blank field = Fax, concatenate username and 1 and @ and example.com = Alternate email address, fake street address = Address, real Sydney suburb = City, NSW = State or province, postcode of the suburb = ZIP or postal code, Australia = Country or region. There should be a maximum of 5 unique suburb names. There should be a maximum of 4 unique departments. There should be a maximum of 8 unique job titles.
Let’s break it down
What: Create a CSV format
How much: 24 users
Fields: I’ve used a pattern of a comma separated list of data description = name of the column. Some examples you’ll see in this prompt:
Real vs Fake
Blank columns
Concatenation of values
Re-use of values, for example First name is in the username, first name, and full name columns
Geographical grounding, for example Sydney suburbs
Constant values, for example State and country
Dependencies, for example postcode should be the postcode of the suburb
Constraints
Maximum unique departments, job titles etc
Example:

In Progress:

Output:
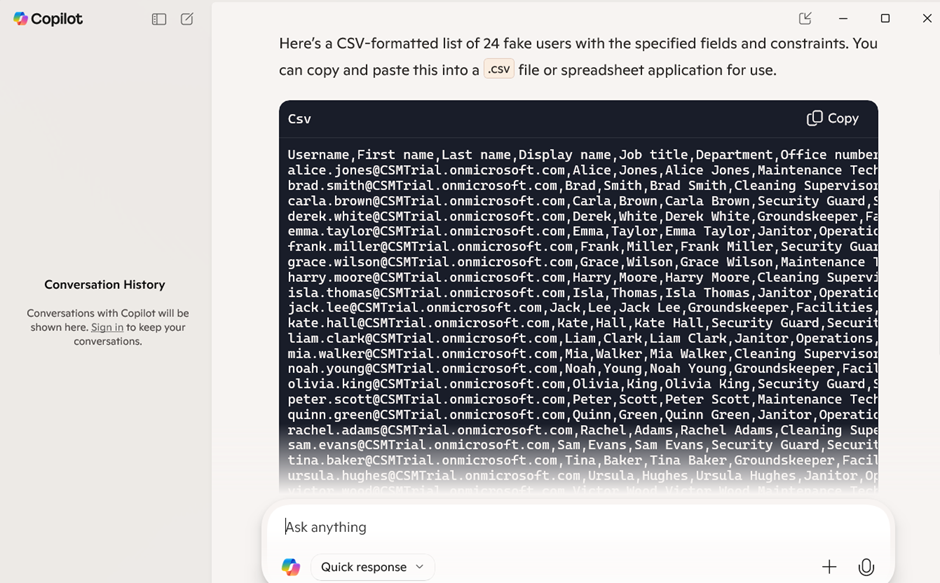
Copy and paste to Excel (csv):

Example Step 3 - Review the results and iterate
Iteration 1 – the data set is too uniform, with 6 users per suburb.

Let’s mix it up:

Our new distribution:

Iteration 2 – we want to create a Departments table, with the department name and a description its purpose

The full output:
departmentName,departmentDescription
Facilities,"Responsible for the upkeep, repair, and functionality of all physical infrastructure. Includes HVAC systems, lighting, plumbing, and grounds maintenance. Staff perform inspections, manage work orders, and ensure compliance with safety codes. Supports 24/7 operations with rotating shifts and emergency response protocols. Tools used: CMMS software, PPE, and diagnostic equipment."
Operations,"Oversees daily cleaning, janitorial services, and logistical support across all facilities. Tasks include waste management, floor care, restroom sanitation, and supply inventory. Staff follow strict hygiene protocols and use eco-friendly products. KPIs include % of area cleaned per shift, # of incidents reported, and time-to-resolution metrics. Operates under ISO 9001 standards."
Security,"Provides 24/7 surveillance, access control, and incident response. Monitors CCTV systems, patrols premises, and enforces visitor policies. Staff are trained in conflict de-escalation, emergency evacuation, and first aid. Uses RFID badges, alarm systems, and secure logging tools. Reports include # of breaches, response times, and asset protection metrics."
Example Step 4 – Record the requirements, prompts, samples and lessons learned
Thanks for reading this blog post!


Comments